discretize.TreeMesh.plot_image#
- TreeMesh.plot_image(v, v_type='CC', grid=False, view='real', ax=None, clim=None, show_it=False, pcolor_opts=None, stream_opts=None, grid_opts=None, range_x=None, range_y=None, sample_grid=None, stream_thickness=None, stream_threshold=None, **kwargs)[source]#
Plot quantities defined on a given mesh.
This method is primarily used to plot models, scalar quantities and vector quantities defined on 2D meshes. For 3D
discretize.TensorMeshhowever, this method will plot the quantity for every slice of the 3D mesh.- Parameters:
- v
numpy.ndarray Gridded values being plotted. The length of the array depends on the quantity being plotted; e.g. if the quantity is a scalar value defined on mesh nodes, the length must be equal to the number of mesh nodes.
- v_type{‘CC’,’CCV’, ‘N’, ‘F’, ‘Fx’, ‘Fy’, ‘Fz’, ‘E’, ‘Ex’, ‘Ey’, ‘Ez’}
Defines the input parameter v.
- view{‘real’, ‘imag’, ‘abs’, ‘vec’}
For complex scalar quantities, options are included to image the real, imaginary or absolute value. For vector quantities, view must be set to ‘vec’.
- ax
matplotlib.axes.Axes,optional The axes to draw on. None produces a new Axes.
- clim
tupleoffloat,optional length 2 tuple of (vmin, vmax) for the color limits
- range_x, range_y
tupleoffloat,optional length 2 tuple of (min, max) for the bounds of the plot axes.
- pcolor_opts
dict,optional Arguments passed on to
pcolormesh- gridbool,
optional Whether to plot the edges of the mesh cells.
- grid_opts
dict,optional If
gridis true, arguments passed on toplotfor grid- sample_grid
tupleofnumpy.ndarray,optional If
view== ‘vec’, mesh cell widths (hx, hy) to interpolate onto for vector plotting- stream_opts
dict,optional If
view== ‘vec’, arguments passed on tostreamplot- stream_thickness
float,optional If
view== ‘vec’, linewidth forstreamplot- stream_threshold
float,optional If
view== ‘vec’, only plots vectors with magnitude above this threshold- show_itbool,
optional Whether to call plt.show()
- numberingbool,
optional For 3D
TensorMeshonly, show the numbering of the slices- annotation_color
Colororstr,optional For 3D
TensorMeshonly, color of the annotation
- v
Examples
2D
TensorMeshplotting>>> from matplotlib import pyplot as plt >>> import discretize >>> import numpy as np >>> M = discretize.TensorMesh([20, 20]) >>> v = np.sin(M.gridCC[:, 0]*2*np.pi)*np.sin(M.gridCC[:, 1]*2*np.pi) >>> M.plot_image(v) >>> plt.show()
(
Source code,png,pdf)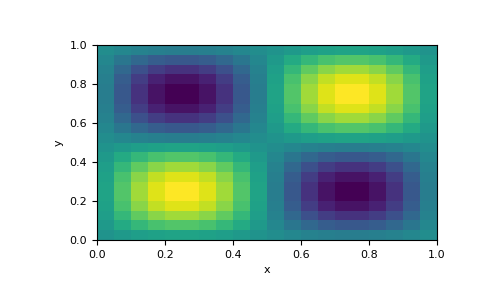
3D
TensorMeshplotting>>> import discretize >>> import numpy as np >>> M = discretize.TensorMesh([20, 20, 20]) >>> v = np.sin(M.gridCC[:, 0]*2*np.pi)*np.sin(M.gridCC[:, 1]*2*np.pi)*np.sin(M.gridCC[:, 2]*2*np.pi) >>> M.plot_image(v, annotation_color='k') >>> plt.show()