discretize.utils.active_from_xyz#
- discretize.utils.active_from_xyz(mesh, xyz, grid_reference='CC', method='linear')[source]#
Return boolean array indicating which cells are below surface.
For a set of locations defining a surface, active_from_xyz outputs a boolean array indicating which mesh cells like below the surface points. This method uses SciPy’s interpolation routine to interpolate between location points defining the surface. Nearest neighbour interpolation is used for cells outside the convex hull of the surface points.
- Parameters:
- mesh
discretize.TensorMeshordiscretize.TreeMeshordiscretize.CylindricalMesh Mesh object. If mesh is a cylindrical mesh, it must be symmetric
- xyz(
N,dim)numpy.ndarray Points defining the surface topography.
- grid_reference{‘CC’, ‘N’}
Define where the cell is defined relative to surface. Choose between {‘CC’,’N’}
If ‘CC’ is used, cells are active if their centers are below the surface.
If ‘N’ is used, cells are active if they lie entirely below the surface.
- method{‘linear’, ‘nearest’}
Interpolation method for locations between the xyz points.
- mesh
- Returns:
- (
n_cells)numpy.ndarrayofbool 1D mask array of bool for the active cells below xyz.
- (
Examples
Here we define the active cells below a parabola. We demonstrate the differences that appear when using the ‘CC’ and ‘N’ options for reference_grid.
>>> import matplotlib.pyplot as plt
>>> import numpy as np
>>> from discretize import TensorMesh
>>> from discretize.utils import active_from_xyz
Determine active cells for a given mesh and topography
>>> mesh = TensorMesh([5, 5])
>>> topo_func = lambda x: -3*(x-0.2)*(x-0.8)+.5
>>> topo_points = np.linspace(0, 1)
>>> topo_vals = topo_func(topo_points)
>>> active_cc = active_from_xyz(mesh, np.c_[topo_points, topo_vals], grid_reference='CC')
>>> active_n = active_from_xyz(mesh, np.c_[topo_points, topo_vals], grid_reference='N')
Plot visual representation
>>> ax = plt.subplot(121)
>>> mesh.plot_image(active_cc, ax=ax)
>>> mesh.plot_grid(centers=True, ax=ax)
>>> ax.plot(np.linspace(0,1), topo_func(np.linspace(0,1)), color='C3')
>>> ax.set_title("CC")
>>> ax = plt.subplot(122)
>>> mesh.plot_image(active_n, ax=ax)
>>> mesh.plot_grid(nodes=True, ax=ax)
>>> ax.plot(np.linspace(0,1), topo_func(np.linspace(0,1)), color='C3')
>>> ax.set_title("N")
>>> plt.show()
(
Source code,png,pdf)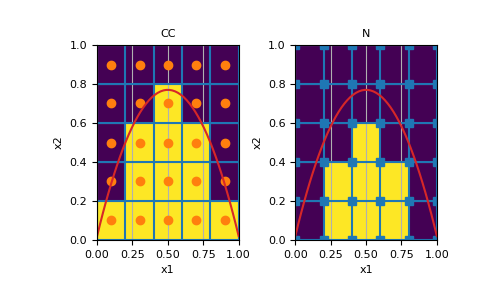