discretize.SimplexMesh.faces#
- property SimplexMesh.faces#
Gridded face locations.
This property returns a numpy array of shape (n_faces, dim) containing gridded locations for all faces in the mesh.
For structued meshes, the first row corresponds to the bottom-front-leftmost x-face. The output array returns the x-faces, then the y-faces, then the z-faces; i.e. mesh.faces is equivalent to np.r_[mesh.faces_x, mesh.faces_y, mesh.face_z] . For each face type, the locations are ordered along the x, then y, then z directions.
- Returns:
- (
n_faces,dim)numpy.ndarrayoffloat Gridded face locations
- (
Examples
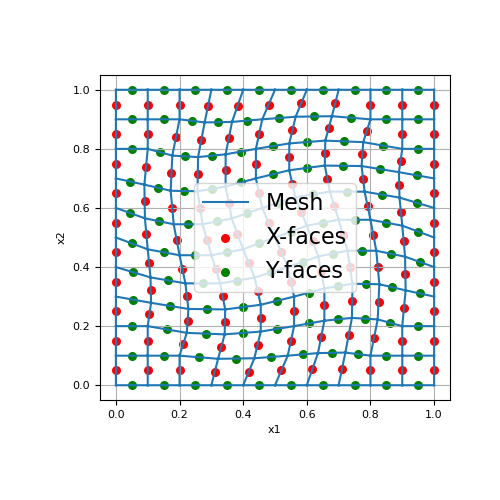
Here, we provide an example of a minimally staggered curvilinear mesh. In this case, the x and y-faces have normal vectors that are primarily along the x and y-directions, respectively.
>>> from discretize import CurvilinearMesh
>>> from discretize.utils import example_curvilinear_grid, mkvc
>>> from matplotlib import pyplot as plt
>>> x, y = example_curvilinear_grid([10, 10], "rotate")
>>> mesh1 = CurvilinearMesh([x, y])
>>> faces = mesh1.faces
>>> x_faces = faces[:mesh1.n_faces_x]
>>> y_faces = faces[mesh1.n_faces_x:]
>>> fig1 = plt.figure(figsize=(5, 5))
>>> ax1 = fig1.add_subplot(111)
>>> mesh1.plot_grid(ax=ax1)
>>> ax1.scatter(x_faces[:, 0], x_faces[:, 1], 30, 'r')
>>> ax1.scatter(y_faces[:, 0], y_faces[:, 1], 30, 'g')
>>> ax1.legend(['Mesh', 'X-faces', 'Y-faces'], fontsize=16)
>>> plt.show()
(
Source code,png,pdf)
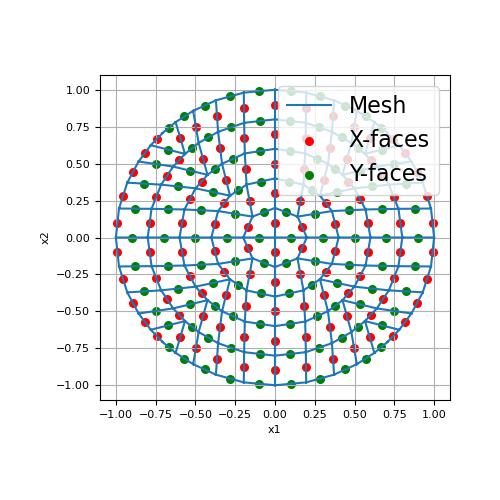
Here, we provide an example of a highly irregular curvilinear mesh. In this case, the y-faces are not defined by normal vectors along a particular direction.
>>> x, y = example_curvilinear_grid([10, 10], "sphere")
>>> mesh2 = CurvilinearMesh([x, y])
>>> faces = mesh2.faces
>>> x_faces = faces[:mesh2.n_faces_x]
>>> y_faces = faces[mesh2.n_faces_x:]
>>> fig2 = plt.figure(figsize=(5, 5))
>>> ax2 = fig2.add_subplot(111)
>>> mesh2.plot_grid(ax=ax2)
>>> ax2.scatter(x_faces[:, 0], x_faces[:, 1], 30, 'r')
>>> ax2.scatter(y_faces[:, 0], y_faces[:, 1], 30, 'g')
>>> ax2.legend(['Mesh', 'X-faces', 'Y-faces'], fontsize=16)
>>> plt.show()