discretize.SimplexMesh.edge_curl#
- property SimplexMesh.edge_curl#
Edge curl operator (edges to faces).
This property constructs the 2nd order numerical curl operator that maps from edges to faces. The operator is a sparse matrix \(\mathbf{C_e}\) that can be applied as a matrix-vector product to a discrete vector quantity u that lives on the edges; i.e.:
curl_u = Ce @ u
Once constructed, the operator is stored permanently as a property of the mesh.
- Returns:
- (
n_faces,n_edges)scipy.sparse.csr_matrix The numerical curl operator from edges to faces
- (
Notes
In continuous space, the curl operator is defined as:
\[\begin{split}\vec{w} = \nabla \times \vec{u} = \begin{vmatrix} \hat{x} & \hat{y} & \hat{z} \\ \partial_x & \partial_y & \partial_z \\ u_x & u_y & u_z \end{vmatrix}\end{split}\]Where \(\mathbf{u}\) is the discrete representation of the continuous variable \(\vec{u}\) on cell edges and \(\mathbf{w}\) is the discrete representation of the curl on the faces, edge_curl constructs a discrete linear operator \(\mathbf{C_e}\) such that:
\[\mathbf{w} = \mathbf{C_e \, u}\]The computation of the curl on mesh faces can be expressed according to the integral form below. For face \(i\) bordered by a set of edges indexed by subset \(K\):
\[w_i = \frac{1}{A_i} \sum_{k \in K} \vec{u}_k \cdot \vec{\ell}_k\]where \(A_i\) is the surface area of face i, \(u_k\) is the value of \(\vec{u}\) on face k, and vec{ell}_k is the path along edge k.
Examples
Below, we demonstrate the mapping and sparsity of the edge curl for a 3D tensor mesh. We choose a the index for a single face, and illustrate which edges are used to compute the curl on that face.
>>> from discretize import TensorMesh
>>> from discretize.utils import mkvc
>>> import matplotlib.pyplot as plt
>>> import numpy as np
>>> import matplotlib as mpl
>>> import mpl_toolkits.mplot3d as mp3d
>>> mpl.rcParams.update({'font.size': 14})
Create a simple tensor mesh, and grab the edge_curl operator:
>>> mesh = TensorMesh([[(1, 2)], [(1, 2)], [(1, 2)]])
>>> Ce = mesh.edge_curl
Then we choose a face for illustration purposes:
>>> face_ind = 2  # Index of a face in the mesh (could be x, y or z)
>>> edge_ind = np.where(
...     np.sum((mesh.edges-mesh.faces[face_ind, :])**2, axis=1) <= 0.5 + 1e-6
... )[0]
>>> face = mesh.faces[face_ind, :]
>>> face_norm = mesh.face_normals[face_ind, :]
>>> edges = mesh.edges[edge_ind, :]
>>> edge_tan = mesh.edge_tangents[edge_ind, :]
>>> node = np.min(edges, axis=0)
>>> min_edges = np.min(edges, axis=0)
>>> max_edges = np.max(edges, axis=0)
>>> if face_norm[0] == 1:
...     k = (edges[:, 1] == min_edges[1]) | (edges[:, 2] == max_edges[2])
...     poly = node + np.c_[np.r_[0, 0, 0, 0], np.r_[0, 1, 1, 0], np.r_[0, 0, 1, 1]]
...     ds = [0.07, -0.07, -0.07]
... elif face_norm[1] == 1:
...     k = (edges[:, 0] == max_edges[0]) | (edges[:, 2] == min_edges[2])
...     poly = node + np.c_[np.r_[0, 1, 1, 0], np.r_[0, 0, 0, 0], np.r_[0, 0, 1, 1]]
...     ds = [0.07, -0.09, -0.07]
... elif face_norm[2] == 1:
...     k = (edges[:, 0] == min_edges[0]) | (edges[:, 1] == max_edges[1])
...     poly = node + np.c_[np.r_[0, 1, 1, 0], np.r_[0, 0, 1, 1], np.r_[0, 0, 0, 0]]
...     ds = [0.07, -0.09, -0.07]
>>> edge_tan[k, :] *= -1
Plot the curve and its mapping for a single face.
>>> fig = plt.figure(figsize=(10, 15))
>>> ax1 = fig.add_axes([0, 0.35, 1, 0.6], projection='3d', elev=25, azim=-60)
>>> mesh.plot_grid(ax=ax1)
>>> ax1.plot(
...     mesh.edges[edge_ind, 0], mesh.edges[edge_ind, 1], mesh.edges[edge_ind, 2],
...     "go", markersize=10
... )
>>> ax1.plot(
...     mesh.faces[face_ind, 0], mesh.faces[face_ind, 1], mesh.faces[face_ind, 2],
...     "rs", markersize=10
... )
>>> poly = mp3d.art3d.Poly3DCollection(
...     [poly], alpha=0.1, facecolor='r', linewidth=None
... )
>>> ax1.add_collection(poly)
>>> ax1.quiver(
...     edges[:, 0], edges[:, 1], edges[:, 2],
...     0.5*edge_tan[:, 0], 0.5*edge_tan[:, 1], 0.5*edge_tan[:, 2],
...     edgecolor='g', pivot='middle', linewidth=4, arrow_length_ratio=0.25
... )
>>> ax1.text(face[0]+ds[0], face[1]+ds[1], face[2]+ds[2], "{0:d}".format(face_ind), color="r")
>>> for ii, loc in zip(range(len(edge_ind)), edges):
...     ax1.text(loc[0]+ds[0], loc[1]+ds[1], loc[2]+ds[2], "{0:d}".format(edge_ind[ii]), color="g")
>>> ax1.legend(
...     ['Mesh', r'$\mathbf{u}$ (edges)', r'$\mathbf{w}$ (face)'],
...     loc='upper right', fontsize=14
... )
Manually make axis properties invisible
>>> ax1.set_xticks([])
>>> ax1.set_yticks([])
>>> ax1.set_zticks([])
>>> ax1.xaxis.set_pane_color((1.0, 1.0, 1.0, 0.0))
>>> ax1.yaxis.set_pane_color((1.0, 1.0, 1.0, 0.0))
>>> ax1.zaxis.set_pane_color((1.0, 1.0, 1.0, 0.0))
>>> ax1.xaxis.line.set_color((1.0, 1.0, 1.0, 0.0))
>>> ax1.yaxis.line.set_color((1.0, 1.0, 1.0, 0.0))
>>> ax1.zaxis.line.set_color((1.0, 1.0, 1.0, 0.0))
>>> ax1.set_xlabel('X', labelpad=-15, fontsize=16)
>>> ax1.set_ylabel('Y', labelpad=-20, fontsize=16)
>>> ax1.set_zlabel('Z', labelpad=-20, fontsize=16)
>>> ax1.set_title("Mapping for a Single Face", fontsize=16, pad=-15)
>>> ax2 = fig.add_axes([0.05, 0.05, 0.9, 0.3])
>>> ax2.spy(Ce)
>>> ax2.set_title("Spy Plot", fontsize=16, pad=5)
>>> ax2.set_ylabel("Face Index", fontsize=12)
>>> ax2.set_xlabel("Edge Index", fontsize=12)
>>> plt.show()
(
Source code,png,pdf)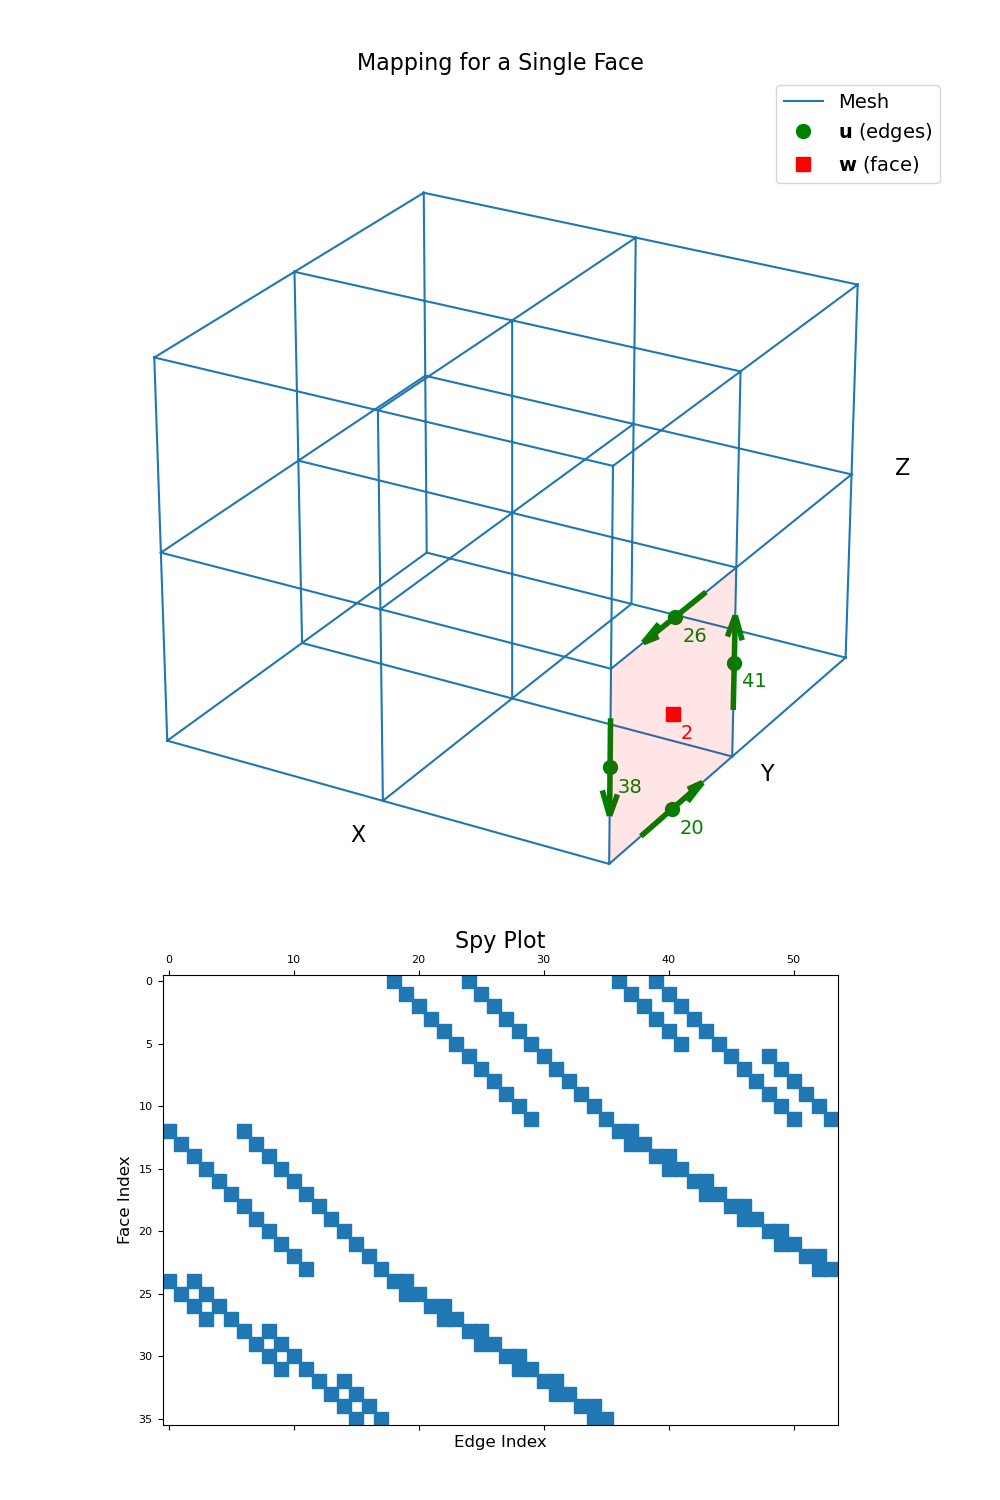