discretize.mixins.InterfaceMPL.plot_grid#
- InterfaceMPL.plot_grid(ax=None, nodes=False, faces=False, centers=False, edges=False, lines=True, show_it=False, **kwargs)[source]#
Plot the grid for nodal, cell-centered and staggered grids.
For 2D and 3D meshes, this method plots the mesh grid. Additionally, the user can choose to denote edge, face, node and cell center locations. This function is built upon the
matplotlib.pyplot.plotfunction and will accept associated keyword arguments.- Parameters:
- ax
matplotlib.axes.AxesorNone,optional The axes to draw on. None produces a new axes.
- nodes, faces, centers, edges, linesbool,
optional Whether to plot the corresponding item
- show_itbool,
optional whether to call plt.show()
- color
Colororstr,optional If lines=True, defines the color of the grid lines.
- linewidth
float,optional If lines=True, defines the thickness of the grid lines.
- ax
- Returns:
matplotlib.axes.AxesAxes handle for the plot
- Other Parameters:
- edges_x, edges_y, edges_z, faces_x, faces_y, faces_zbool,
optional When plotting a
TreeMesh, these are also options to plot the individual component items.- cell_linebool,
optional When plotting a
TreeMesh, you can also plot a line through the cell centers in order.- slice{‘both’, ‘theta’, ‘z’}
When plotting a
CylindricalMesh, which dimension to slice over.
- edges_x, edges_y, edges_z, faces_x, faces_y, faces_zbool,
Notes
Excess arguments are passed on to plot
Examples
Plotting a 2D TensorMesh grid
>>> from matplotlib import pyplot as plt
>>> import discretize
>>> import numpy as np
>>> h1 = np.linspace(.1, .5, 3)
>>> h2 = np.linspace(.1, .5, 5)
>>> mesh = discretize.TensorMesh([h1, h2])
>>> mesh.plot_grid(nodes=True, faces=True, centers=True, lines=True)
>>> plt.show()
(
Source code,png,pdf)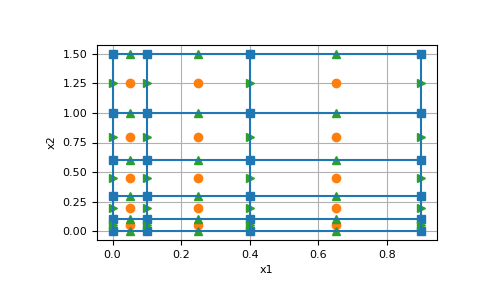
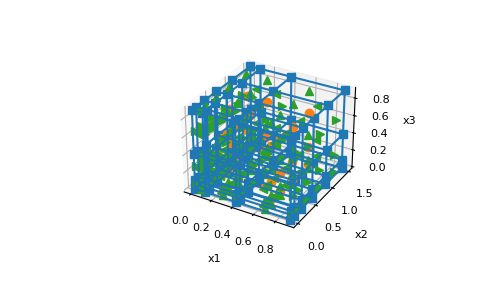
Plotting a 3D TensorMesh grid
>>> from matplotlib import pyplot as plt
>>> import discretize
>>> import numpy as np
>>> h1 = np.linspace(.1, .5, 3)
>>> h2 = np.linspace(.1, .5, 5)
>>> h3 = np.linspace(.1, .5, 3)
>>> mesh = discretize.TensorMesh([h1, h2, h3])
>>> mesh.plot_grid(nodes=True, faces=True, centers=True, lines=True)
>>> plt.show()

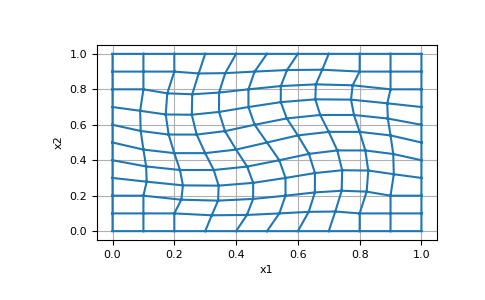
Plotting a 2D CurvilinearMesh
>>> from matplotlib import pyplot as plt
>>> import discretize
>>> X, Y = discretize.utils.example_curvilinear_grid([10, 10], 'rotate')
>>> M = discretize.CurvilinearMesh([X, Y])
>>> M.plot_grid()
>>> plt.show()
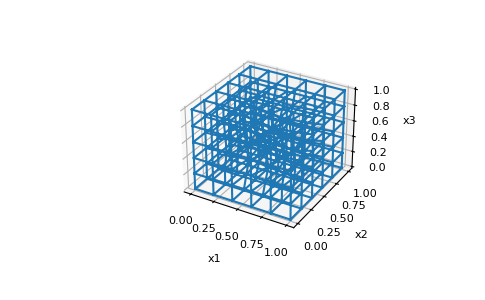
Plotting a 3D CurvilinearMesh
>>> from matplotlib import pyplot as plt
>>> import discretize
>>> X, Y, Z = discretize.utils.example_curvilinear_grid([5, 5, 5], 'rotate')
>>> M = discretize.CurvilinearMesh([X, Y, Z])
>>> M.plot_grid()
>>> plt.show()

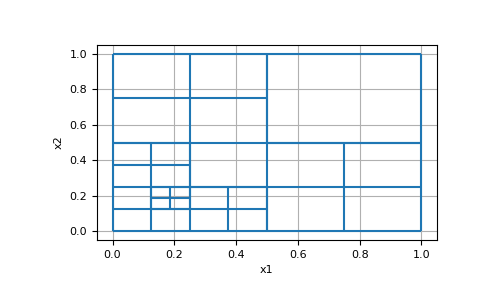
Plotting a 2D TreeMesh
>>> from matplotlib import pyplot as plt
>>> import discretize
>>> M = discretize.TreeMesh([32, 32])
>>> M.insert_cells([[0.25, 0.25]], [4])
>>> M.plot_grid()
>>> plt.show()

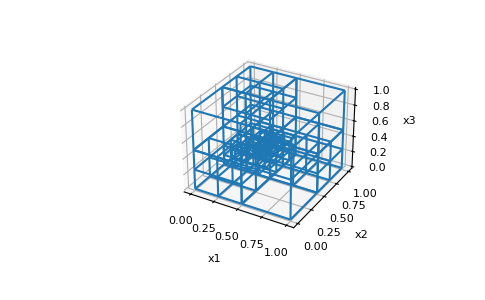
Plotting a 3D TreeMesh
>>> from matplotlib import pyplot as plt
>>> import discretize
>>> M = discretize.TreeMesh([32, 32, 32])
>>> M.insert_cells([[0.3, 0.75, 0.22]], [4])
>>> M.plot_grid()
>>> plt.show()
