Note
Go to the end to download the full example code.
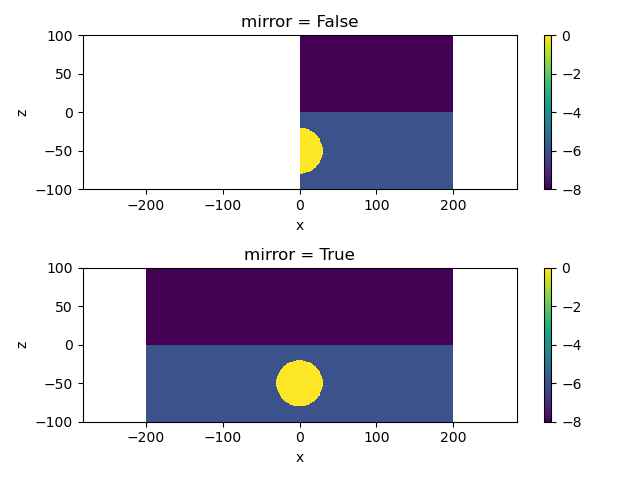
Plot Mirrored Cylindrically Symmetric Model#
Here, we demonstrate plotting a model on a cylindrically symmetric mesh with the plotting symmetric about x=0.
Ignoring fixed x limits to fulfill fixed data aspect with adjustable data limits.
Ignoring fixed x limits to fulfill fixed data aspect with adjustable data limits.
import numpy as np
import matplotlib.pyplot as plt
import discretize


def run(plotIt=True):
    sig_halfspace = 1e-6
    sig_sphere = 1e0
    sig_air = 1e-8

    sphere_z = -50.0
    sphere_radius = 30.0

    # x-direction
    cs = 1
    nc = np.ceil(2.5 * (-(sphere_z - sphere_radius)) / cs)

    # define a mesh
    mesh = discretize.CylindricalMesh([[(cs, nc)], 1, [(cs, nc)]], x0="00C")

    # Put the model on the mesh
    sigma = sig_air * np.ones(mesh.nC)  # start with air cells
    sigma[mesh.gridCC[:, 2] < 0.0] = sig_halfspace  # cells below the earth

    # indices of the sphere
    sphere_ind = (
        mesh.gridCC[:, 0] ** 2 + (mesh.gridCC[:, 2] - sphere_z) ** 2
    ) <= sphere_radius**2
    sigma[sphere_ind] = sig_sphere  # sphere

    if not plotIt:
        return

    # Plot a cross section through the mesh
    fig, ax = plt.subplots(2, 1)
    # Set a nice colormap!
    plt.set_cmap(plt.get_cmap("viridis"))
    plt.colorbar(mesh.plot_image(np.log10(sigma), ax=ax[0])[0], ax=ax[0])
    ax[0].set_title("mirror = False")
    ax[0].axis("equal")
    ax[0].set_xlim([-200.0, 200.0])

    plt.colorbar(mesh.plot_image(np.log10(sigma), ax=ax[1], mirror=True)[0], ax=ax[1])
    ax[1].set_title("mirror = True")
    ax[1].axis("equal")
    ax[1].set_xlim([-200.0, 200.0])

    plt.tight_layout()


if __name__ == "__main__":
    run()
    plt.show()
Total running time of the script: (0 minutes 0.222 seconds)