Note
Go to the end to download the full example code.
Tensor meshes#
Tensor meshes are the most basic class of meshes that can be created with
discretize. They belong to the class (TensorMesh).
Tensor meshes can be defined in 1, 2 or 3 dimensions. Here we demonstrate:
How to create basic tensor meshes
How to include padding cells
How to plot tensor meshes
How to extract properties from meshes
Import Packages#
Here we import the packages required for this tutorial.
from discretize import TensorMesh
import matplotlib.pyplot as plt
import numpy as np

# sphinx_gallery_thumbnail_number = 3
Basic Example#
The easiest way to define a tensor mesh is to define the cell widths in x, y and z as 1D numpy arrays. And to provide the position of the bottom southwest corner of the mesh. We demonstrate this here for a 2D mesh (thus we do not need to consider the z-dimension).
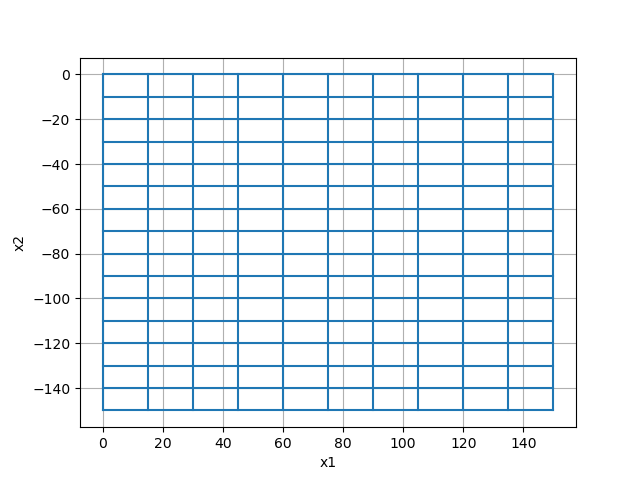
<Axes: xlabel='x1', ylabel='x2'>
Padding Cells and Plotting#
For practical purposes, the user may want to define a region where the cell widths are increasing/decreasing in size. For example, padding is often used to define a large domain while reducing the total number of mesh cells. Here we demonstrate how to create tensor meshes that have padding cells.
ncx = 10  # number of core mesh cells in x
ncy = 15  # number of core mesh cells in y
dx = 15  # base cell width x
dy = 10  # base cell width y
npad_x = 4  # number of padding cells in x
npad_y = 4  # number of padding cells in y
exp_x = 1.25  # expansion rate of padding cells in x
exp_y = 1.25  # expansion rate of padding cells in y

# Use a list of tuples to define cell widths in each direction. Each tuple
# contains the cell width, number of cells and the expansion factor. A
# negative sign is used to indicate an interval where cells widths go
# from largest to smallest.
hx = [(dx, npad_x, -exp_x), (dx, ncx), (dx, npad_x, exp_x)]
hy = [(dy, npad_y, -exp_y), (dy, ncy), (dy, npad_y, exp_y)]

# We can use flags 'C', '0' and 'N' to shift the xyz position of the mesh
# relative to the origin
mesh = TensorMesh([hx, hy], x0="CN")

# We can apply the plot_grid method and output to a specified axes object
fig = plt.figure(figsize=(6, 6))
ax = fig.add_subplot(111)
mesh.plot_grid(ax=ax)
ax.set_xbound(mesh.x0[0], mesh.x0[0] + np.sum(mesh.h[0]))
ax.set_ybound(mesh.x0[1], mesh.x0[1] + np.sum(mesh.h[1]))
ax.set_title("Tensor Mesh")
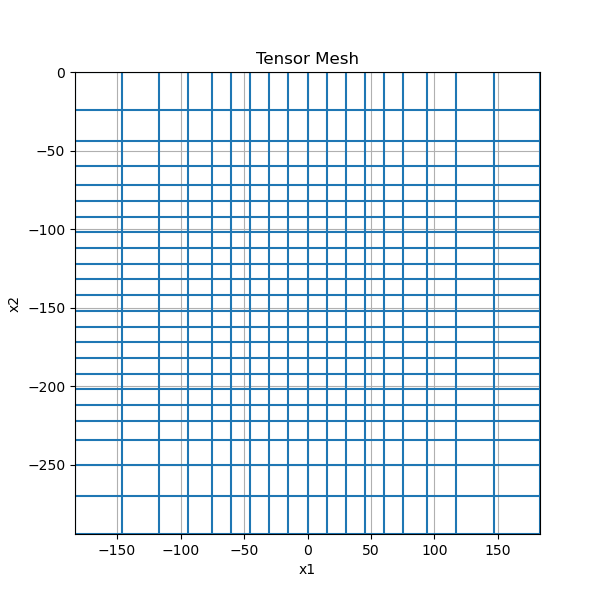
Text(0.5, 1.0, 'Tensor Mesh')
Extracting Mesh Properties#
Once the mesh is created, you may want to extract certain properties. Here, we show some properties that can be extracted from 2D meshes.
ncx = 10  # number of core mesh cells in x
ncy = 15  # number of core mesh cells in y
dx = 15  # base cell width x
dy = 10  # base cell width y
npad_x = 4  # number of padding cells in x
npad_y = 4  # number of padding cells in y
exp_x = 1.25  # expansion rate of padding cells in x
exp_y = 1.25  # expansion rate of padding cells in y

hx = [(dx, npad_x, -exp_x), (dx, ncx), (dx, npad_x, exp_x)]
hy = [(dy, npad_y, -exp_y), (dy, ncy), (dy, npad_y, exp_y)]

mesh = TensorMesh([hx, hy], x0="C0")

# The bottom west corner
x0 = mesh.x0

# The total number of cells
nC = mesh.nC

# An (nC, 2) array containing the cell-center locations
cc = mesh.gridCC

# A boolean array specifying which cells lie on the boundary
bInd = mesh.cell_boundary_indices

# Plot the cell areas (2D "volume")
s = mesh.cell_volumes

fig = plt.figure(figsize=(6, 6))
ax = fig.add_subplot(111)
mesh.plot_image(s, grid=True, ax=ax)
ax.set_xbound(mesh.x0[0], mesh.x0[0] + np.sum(mesh.h[0]))
ax.set_ybound(mesh.x0[1], mesh.x0[1] + np.sum(mesh.h[1]))
ax.set_title("Cell Areas")
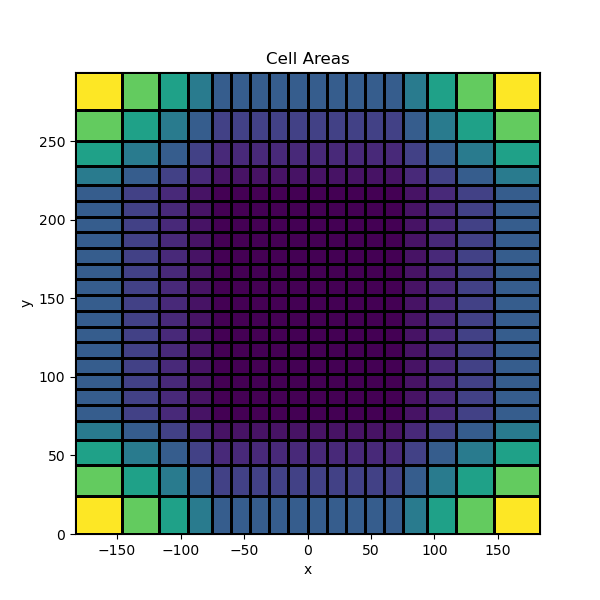
Text(0.5, 1.0, 'Cell Areas')
3D Example#
Here we show how the same approach can be used to create and extract properties from a 3D tensor mesh.
nc = 10  # number of core mesh cells in x, y and z
dh = 10  # base cell width in x, y and z
npad = 5  # number of padding cells
exp = 1.25  # expansion rate of padding cells

h = [(dh, npad, -exp), (dh, nc), (dh, npad, exp)]
mesh = TensorMesh([h, h, h], x0="C00")

# The bottom southwest corner
x0 = mesh.x0

# The total number of cells
nC = mesh.nC

# An (nC, 3) array containing the cell-center locations
cc = mesh.gridCC

# A boolean array specifying which cells lie on the boundary
bInd = mesh.cell_boundary_indices

# The cell volumes
v = mesh.cell_volumes

# Plot all cells volumes or plot cell volumes for a particular horizontal slice
fig = plt.figure(figsize=(9, 4))
ax1 = fig.add_subplot(121)
ax2 = fig.add_subplot(122)

mesh.plot_image(np.log10(v), grid=True, ax=ax1)
ax1.set_title("All Cell Log-Volumes")

cplot = mesh.plot_slice(np.log10(v), grid=True, ax=ax2, normal="Z", ind=2)
cplot[0].set_clim(np.min(np.log10(v)), np.max(np.log10(v)))
ax2.set_title("Cell Log-Volumes #2")
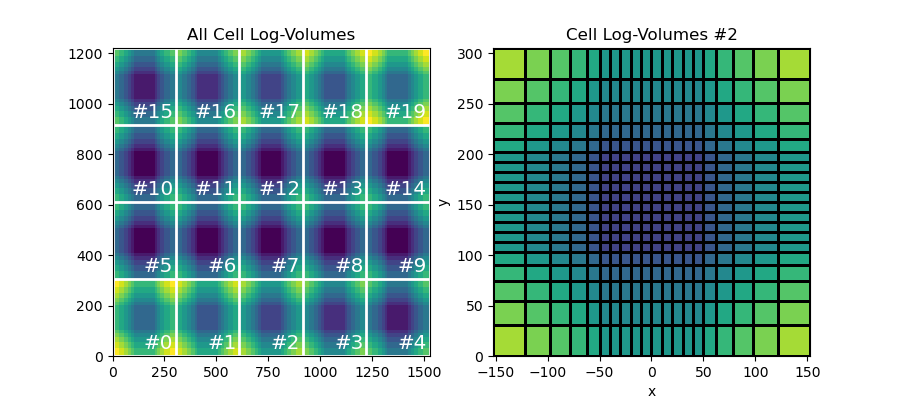
Text(0.5, 1.0, 'Cell Log-Volumes #2')
Total running time of the script: (0 minutes 0.231 seconds)