Note
Go to the end to download the full example code.
Basic: PlotImage#
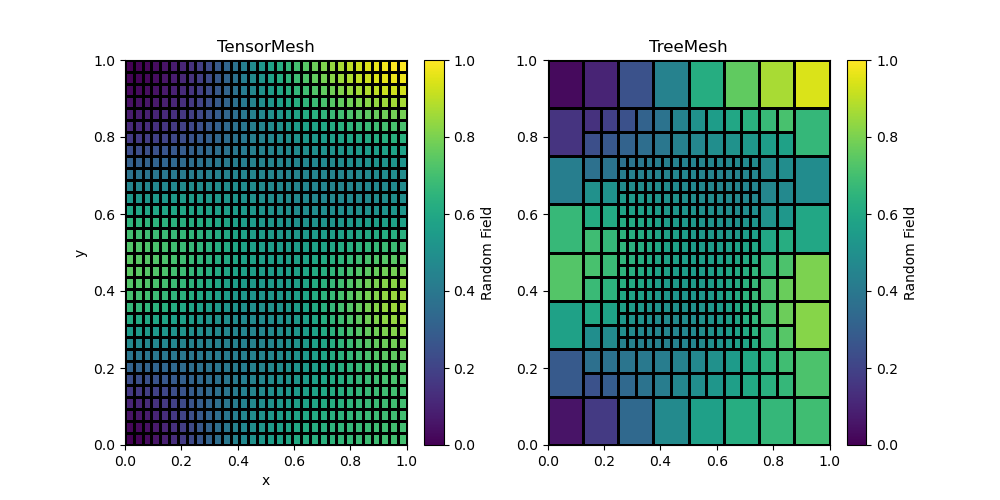
You can use M.PlotImage to plot images on all of the Meshes.

import discretize
import matplotlib.pyplot as plt


def run(plotIt=True):
    M = discretize.TensorMesh([32, 32])
    v = discretize.utils.random_model(M.vnC, random_seed=789)
    v = discretize.utils.mkvc(v)

    O = discretize.TreeMesh([32, 32])

    def function(cell):
        if (
            cell.center[0] < 0.75
            and cell.center[0] > 0.25
            and cell.center[1] < 0.75
            and cell.center[1] > 0.25
        ):
            return 5
        if (
            cell.center[0] < 0.9
            and cell.center[0] > 0.1
            and cell.center[1] < 0.9
            and cell.center[1] > 0.1
        ):
            return 4
        return 3

    O.refine(function)

    P = M.get_interpolation_matrix(O.gridCC, "CC")

    ov = P * v

    if not plotIt:
        return

    fig, axes = plt.subplots(1, 2, figsize=(10, 5))

    out = M.plot_image(v, grid=True, ax=axes[0])
    cb = plt.colorbar(out[0], ax=axes[0])
    cb.set_label("Random Field")
    axes[0].set_title("TensorMesh")

    out = O.plot_image(ov, grid=True, ax=axes[1], clim=[0, 1])
    cb = plt.colorbar(out[0], ax=axes[1])
    cb.set_label("Random Field")
    axes[1].set_title("TreeMesh")


if __name__ == "__main__":
    run()
    plt.show()
Total running time of the script: (0 minutes 0.158 seconds)
