discretize.utils.index_cube#
- discretize.utils.index_cube(nodes, grid_shape, n=None)[source]#
Return the index of nodes on a tensor (or curvilinear) mesh.
For 2D tensor meshes, each cell is defined by nodes A, B, C and D. And for 3D tensor meshes, each cell is defined by nodes A through H (see below). index_cube outputs the indices for the specified node(s) for all cells in the mesh.
TWO DIMENSIONS:
node(i,j+1)      node(i+i,j+1)
     B -------------- C
     |                |
     |    cell(i,j)   |
     |        I       |
     |                |
     A -------------- D
 node(i,j)        node(i+1,j)
THREE DIMENSIONS:
   node(i,j+1,k+1)    node(i+1,j+1,k+1)
           F ---------------- G
          /|                / |
         / |               /  |
        /  |              /   |
node(i,j,k+1)     node(i+1,j,k+1)
      E --------------- H     |
      |    B -----------|---- C
      |   / cell(i,j,k) |   /
      |  /        I     |  /
      | /               | /
      A --------------- D
 node(i,j,k)     node(i+1,j,k)
- Parameters:
- nodes
str String specifying which nodes to return. For 2D meshes, nodes must be a string containing combinations of the characters ‘A’, ‘B’, ‘C’, or ‘D’. For 3D meshes, nodes can also be ‘E’, ‘F’, ‘G’, or ‘H’. Note that order is preserved. E.g. if we want to return the C, D and A node indices in that particular order, we input nodes = ‘CDA’.
- grid_shape
listofint Number of nodes along the i,j,k directions; e.g. [ni,nj,nk]
- nc
listofint Number of cells along the i,j,k directions; e.g. [nci,ncj,nck]
- nodes
- Returns:
- index
tupleofnumpy.ndarray Each entry of the tuple is a 1D
numpy.ndarraycontaining the indices of the nodes specified in the input nodes in the order asked; e.g. if nodes = ‘DCBA’, the tuple returned is ordered (D,C,B,A).
- index
Examples
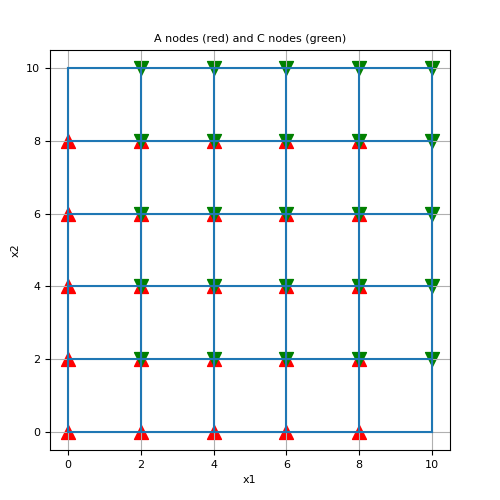
Here, we construct a small 2D tensor mesh (works for a curvilinear mesh as well) and use index_cube to find the indices of the ‘A’ and ‘C’ nodes. We then plot the mesh, as well as the ‘A’ and ‘C’ node locations.
>>> from discretize import TensorMesh
>>> from discretize.utils import index_cube
>>> from matplotlib import pyplot as plt
>>> import numpy as np
Create a simple tensor mesh.
>>> n_cells = 5
>>> h = 2*np.ones(n_cells)
>>> mesh = TensorMesh([h, h], x0='00')
Get indices of ‘A’ and ‘C’ nodes for all cells.
>>> A, C = index_cube('AC', [n_cells+1, n_cells+1])
Plot mesh and the locations of the A and C nodes
>>> fig1 = plt.figure(figsize=(5, 5))
>>> ax1 = fig1.add_axes([0.1, 0.1, 0.8, 0.8])
>>> mesh.plot_grid(ax=ax1)
>>> ax1.scatter(mesh.nodes[A, 0], mesh.nodes[A, 1], 100, 'r', marker='^')
>>> ax1.scatter(mesh.nodes[C, 0], mesh.nodes[C, 1], 100, 'g', marker='v')
>>> ax1.set_title('A nodes (red) and C nodes (green)')
>>> plt.show()
(
Source code,png,pdf)
