discretize.TensorMesh.cell_boundary_indices#
- property TensorMesh.cell_boundary_indices#
Return the indices of the x, (y and z) boundary cells.
This property returns the indices of the cells on the x, (y and z) boundaries, respectively. Note that each axis direction will have both a lower and upper boundary. The property will return the indices corresponding to the lower and upper boundaries separately.
E.g. for a 2D domain, there are 2 x-boundaries and 2 y-boundaries (4 in total). In this case, the return is a list of length 4 organized [ind_Bx1, ind_Bx2, ind_By1, ind_By2]:
           By2
    + ------------- +
    |               |
    |               |
Bx1 |               | Bx2
    |               |
    |               |
    + ------------- +
           By1
- Returns:
- (2 *
dim)listofnumpy.ndarrayofbool The length of list returned depends on the dimension of the mesh (= 2 x dim). And the length of each array containing the indices is equal to the number of cells in the mesh. For 1D, 2D and 3D tensor meshes, the returns take the following form:
1D: returns [ind_Bx1, ind_Bx2]
2D: returns [ind_Bx1, ind_Bx2, ind_By1, ind_By2]
3D: returns [ind_Bx1, ind_Bx2, ind_By1, ind_By2, ind_Bz1, ind_Bz2]
- (2 *
Examples
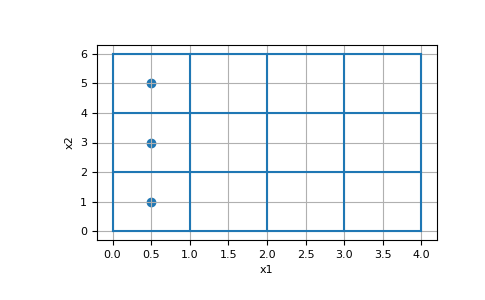
Here, we construct a 4 by 3 cell 2D tensor mesh and return the indices of the x and y-boundary cells. In this case there are 3 cells touching each x-boundary, and there are 4 cells touching each y-boundary.
>>> from discretize import TensorMesh
>>> import numpy as np
>>> import matplotlib.pyplot as plt
>>> hx = [1, 1, 1, 1]
>>> hy = [2, 2, 2]
>>> mesh = TensorMesh([hx, hy])
>>> ind_Bx1, ind_Bx2, ind_By1, ind_By2 = mesh.cell_boundary_indices
>>> ax = plt.subplot(111)
>>> mesh.plot_grid(ax=ax)
>>> ax.scatter(*mesh.cell_centers[ind_Bx1].T)
>>> plt.show()
(
Source code,png,pdf)
